#Reading the data from the webpage
#and making it suitable for plotting by skipping some non numeric characters and strings
clm<-read.table("http://data.giss.nasa.gov/gistemp/graphs/Fig.A2.txt", sep="", skip = 4, nrows = 131, na.strings = "*")
#Plotting the first set of data (first column)
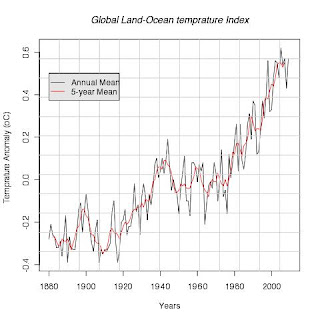
plot((clm[,c(1,2)]), type = "l", xlab = "Years" , ylab = "Temprature Anomaly (oC)", main = "Global Land-Ocean temprature Index", col = "black")
#plotting the second columns od data
lines((clm[,c(1,3)]), lty = 1, col = "red")
#creating the legend and adding it to the plot
legend(1880, 0.5, c("Annual Mean", "5-year Mean"), col = c(1,2), lty = c(1, 1), merge = TRUE, bg = 'gray90')
#saving the plot in jpeg fomart
dev.copy(jpeg, "/Users/kdintwe/Documents/Classes/Geog_299B/blog_docs/hockeyStickGraph.jpg")
dev.off()
#saving the plot in pdf fomart
dev.copy(pdf, "/Users/kdintwe/Documents/Classes/Geog_299B/blog_docs/hockeyStickGraph.pdf")
dev.off()

No comments:
Post a Comment