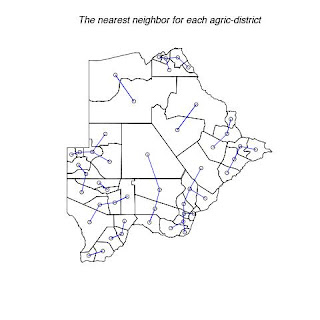
Fig. 1. Shows each district with its nearest neighbor.
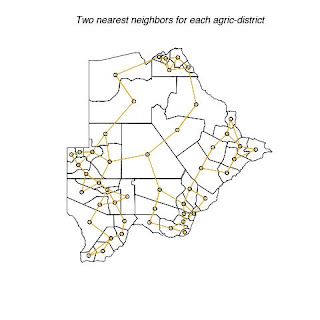
Fig. 2. Shows each district with its two nearest neighbors.
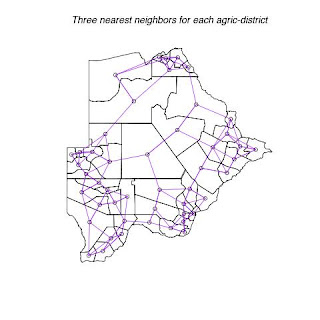 Fig. 3. Shows each district with its three nearest neighbors.
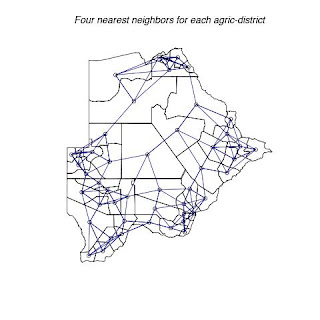 Fig. 4. Shows each district with its four nearest neighbors.
The following four maps below (map 5 to map 7) indicate each agricultural districts in Botswana. They also show threshold distance between the district/neighbors. This information is very useful in terms of transportation, communication and resource allocation. Nearest neighbors may be able to share some resources like transport and personnel. e.g. one officer being responsible for more that one district. It is also easier and cheaper for officers to communicate or visit their nearest neighbors. Officers can share resources easily with their nearest neighbors.
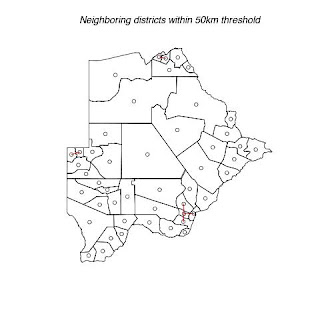
Fig. 5. Shows districts that have a threshold of 50km with their neighbors.
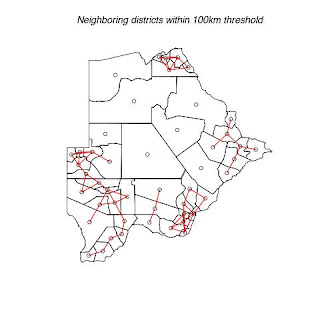
Fig. 6. Shows districts that have a threshold of 100km with their neighbors.
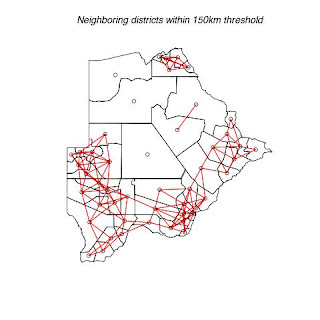
Fig. 7. Shows districts that have a threshold of 150km with their neighbors.
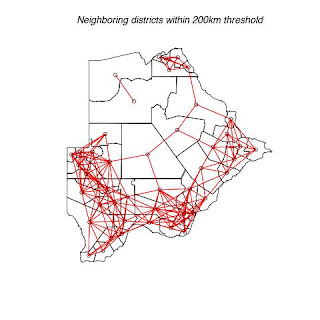 Fig. 8. Shows districts that have a threshold of 150km with their neighbors.
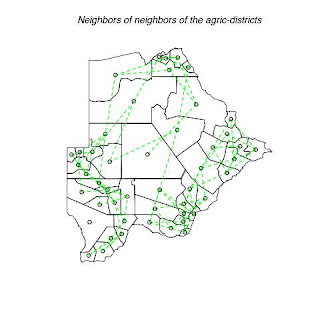 Fig. 9. Indicate the neighbor of neighbors for each district
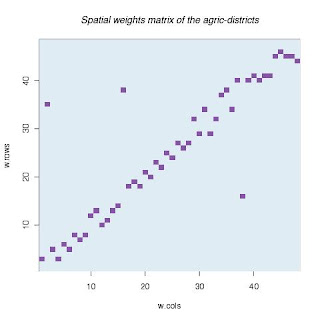 Fig 10. The spatial weights for each district
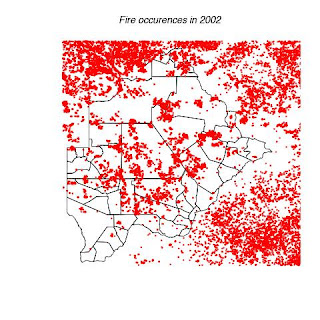
Fig 11. Indicates the location of bush fires that occurred in 2002.
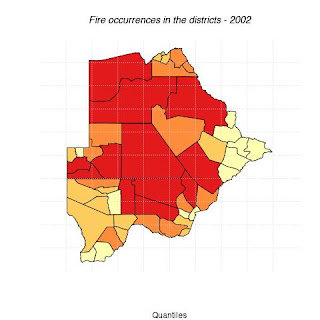 Fig 12. Indicate the intensity of bush fire in each district. The more reddish the color the higher the fire outbreak frequency.
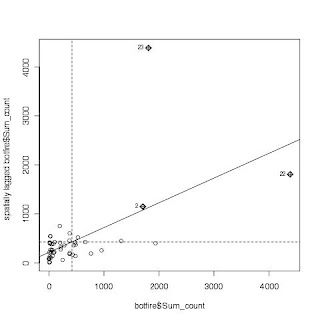
Fig 13. The moran test for the fire outbreak intensity for each district.
I have a problem of explaining figures 10 and 13. I don't know what spatial weight matrix is. Also, I haven't yet understood the moran test.
#The following is the code used to create the above figures and graphs
#Install and load the following packages:
library(spdep)# spatial analysis functions in R;
library(maptools)# used to read shapefiles in R;
library(classInt)# for classifying continuous data;
library(RColorBrewer)# provides nice color schemes for mapping
#Explore the functions of these packages via:
help(spdep)
help(maptools)
help(classInt)
help(RColorBrewer)
#Input the botswana shapefile (botsdistricts.shp) into R;
#read shapefile data into R and set projection to geographic coords, long/lat;
?readShapePoly
botdistrct <- readShapePoly("/Users/kdintwe/Rworkspace/gis_data/fire2002.shp",proj4string=CRS("+proj=longlat"))
#summarize new R object;
summary(botswana)
plot(botdistrct)
#view or display the coordinates
coordinates(botdistrct)
#put centroids into a file and make it a data frame;
centers <- coordinates(botdistrct)
centers <- data.frame(centers)
#plot the coordinates
points(centers,col="blue",cex=0.3, pch = 19)
text(centers,labels=rownames(centers),cex=1.5)
###################################################
#Loading fire data
fire <- readShapePoints("/Users/kdintwe/Rworkspace/gis_data/fire.shp",proj4string=CRS("+proj=longlat"))
plot(fire, add = T, cex = 0.3, col = "red", pch = 19)
#Also can use readShapeLines for line-shape-files
plot(botdistrct, add =T)
title(main = "Fire occurences in 2002")
dev.copy(jpeg, "/Users/kdintwe/Documents/Classes/Geog_299B/blog_docs/wk8/botsfires.jpg")
dev.off()
###################################################
#MEASURING SPACE: nearest neighbors & distance-based neighbors
botdistrct.centers = coordinates(botdistrct)
###################################################
#how many neighbors, k, are of interest? Why?
k=1
#determine the k nearest neighbors for each point in afghan.centers;
knn1 = knearneigh(botdistrct.centers,k,longlat=T)
#create a neighbors list from the knn1 object;
botdistrct.knn1 = knn2nb(knn1)
#map k-nearest neighbors;
plot(botdistrct)
plot(botdistrct.knn1, botdistrct.centers,col="blue",add=T)
title(main = "The nearest neighbor for each agric-district")
dev.copy(jpeg, "/Users/kdintwe/Documents/Classes/Geog_299B/blog_docs/wk8/k1.jpg")
dev.off()
###################################################
k=2
knn2 = knearneigh(botdistrct.centers,k,longlat=T)
botdistrct.knn2 = knn2nb(knn2)
plot(botdistrct)
plot(botdistrct.knn2, botdistrct.centers,col="orange",add=T)
title(main = "Two nearest neighbors for each agric-district")
dev.copy(jpeg, "/Users/kdintwe/Documents/Classes/Geog_299B/blog_docs/wk8/k2.jpg")
dev.off()
###################################################
k=3
knn3 = knearneigh(botdistrct.centers,k,longlat=T)
botdistrct.knn3 = knn3nb(knn3)
plot(botdistrct)
plot(botdistrct.knn3, botdistrct.centers,col="purple",add=T)
title(main = "Three nearest neighbors for each agric-district")
dev.copy(jpeg, "/Users/kdintwe/Documents/Classes/Geog_299B/blog_docs/wk8/k3.jpg")
dev.off()
###################################################
k=4
knn4 = knearneigh(botdistrct.centers,k,longlat=T)
botdistrct.knn4 = knn4nb(knn4)
plot(botdistrct)
plot(botdistrct.knn4, botdistrct.centers,col="navyblue",add=T)
title(main = "Four nearest neighbors for each agric-district")
dev.copy(jpeg, "/Users/kdintwe/Documents/Classes/Geog_299B/blog_docs/wk8/k4.jpg")
dev.off()
###################################################
#Turn 'Recording' on and change the k value to 2, 3, 4 and 5. What happens?
#Neighbors based on distance in kilometers;
d = 100
#create a distance based neighbors object (afghan.dist.100) with a 100km threshold;
botdistrct.dist.100 = dnearneigh(botdistrct.centers,0,d,longlat=T)
#map neighbors based on distance;
plot(botdistrct)
plot(botdistrct.100,botdistrct.centers,add=T,lwd=1,col="red")
title(main = "Neighboring districts within 100km threshold")
#obtain summary report of botdistrct.dist.100 object
summary(botdistrct.100)
dev.copy(jpeg, "/Users/kdintwe/Documents/Classes/Geog_299B/blog_docs/wk8/d100km.jpg")
dev.off()
#Vary the distance threshold and map and summarize your results.
###################################################
d = 150
botdistrct.dist.150 = dnearneigh(botdistrct.centers,0,d,longlat=T)
plot(botdistrct)
plot(botdistrct.dist.150,botdistrct.centers,add=T,lwd=1,col="red")
title(main = "Neighboring districts within 150km threshold")
summary(botdistrct.dist.150)
dev.copy(jpeg, "/Users/kdintwe/Documents/Classes/Geog_299B/blog_docs/wk8/d150km.jpg")
dev.off()
###################################################
d = 50
botdistrct.dist.50 = dnearneigh(botdistrct.centers,0,d,longlat=T)
plot(botdistrct)
plot(botdistrct.dist.50,botdistrct.centers,add=T,lwd=1,col="red")
title(main = "Neighboring districts within 50km threshold")
summary(botdistrct.dist.50)
dev.copy(jpeg, "/Users/kdintwe/Documents/Classes/Geog_299B/blog_docs/wk8/d50km.jpg")
dev.off()
###################################################
d = 200
botdistrct.dist.200 = dnearneigh(botdistrct.centers,0,d,longlat=T)
plot(botdistrct)
plot(botdistrct.dist.200,botdistrct.centers,add=T,lwd=1,col="red")
title(main = "Neighboring districts within 200km threshold")
summary(botdistrctn.dist.200)
dev.copy(jpeg, "/Users/kdintwe/Documents/Classes/Geog_299B/blog_docs/wk8/d200km.jpg")
dev.off()
###################################################
#Spatial lags, i.e., neighbors of neighbors, can also be determined;
#determine 2nd order lags, or neighbors of neighbors, in the botdistrct.knn2 object;
botdistrct.lags = nblag(botdistrct.knn2,2)
#map 2nd order lags;
plot(botdistrct)
plot(botdistrct.lags[[2]],botdistrct.centers, add=T,lwd=1.5,col="green",lty=2)
title(main = "Neighbors of neighbors of the agric-districts")
dev.copy(jpeg, "/Users/kdintwe/Documents/Classes/Geog_299B/blog_docs/wk8/neighborneighbor.jpg")
dev.off()
#visualize the spatial weights matrix that summarizes connectivity
#define the matrix, ie number of columns and rows;
w.cols = 1:48
w.rows = 1:48
#create spatial weights matrix from neighbor object
w.mat.knn = nb2mat(botdistrct.knn1, zero.policy=TRUE)
#return binary spatial weights matrix
w.mat.knn
#visualize binary spatial weights matrix
image(w.cols,w.rows,w.mat.knn,col=brewer.pal(3,"BuPu"))
title(main = "Spatial weights matrix of the agric-districts")
dev.copy(jpeg, "/Users/kdintwe/Documents/Classes/Geog_299B/blog_docs/wk8/spatweigtmatrx.jpg")
dev.off()
#create and visualize distance-based spatial weights matrix;
w.mat.dist = nb2mat(botdistrct.dist.200, zero.policy=TRUE)
image(w.cols,w.rows,w.mat.dist,col=brewer.pal(9,"PuRd"))
title(main = "distance-based spatial weights matrix of the agric-districts")
dev.copy(jpeg, "/Users/kdintwe/Documents/Classes/Geog_299B/blog_docs/wk8/distbasedspwt.jpg")
dev.off()
#read Botswana fires shapefile into R with geographic coordinate system
botfire <- readShapePoly("/Users/kdintwe/Rworkspace/gis_data/fire2002.shp",proj4string=CRS("+proj=longlat"))
#return characterisitics of Afghan shapefile
summary(afghan)
#map afghan shapefile
plot(botfire)
#
breaks = round(quantile(botfire$Sum_count))
colors = c("green","yellow","orange","red") #"red","orange","yellow","green"
plot(botfire,col=colors[findInterval(botfire$Sum_count,breaks,all.inside=TRUE)])
ls()
#display available color palettes in RColorBrewer;
display.brewer.all()
#set the number of colors to use in the map;
nclr = 4
#select number of colors to use from named palette;
plotclr = brewer.pal(nclr,"YlOrRd")
#find class intervals for given variable;
class = classIntervals(botfire$Sum_count,nclr,style="quantile")
# assigns colors to classes;
colcode = findColours(class,plotclr)
#plot map of variable specifed in 'class' command according to specified colors
plot(botfire,col=colcode)
#add title info
title(main="Fire occurrences in the districts - 2002",sub="Quantiles")
#add legend
legend(1,4,legend=names(attr(colcode, "table")),
fill=attr(colcode, "palette"), cex=0.75, bty="n")
grid(10)
dev.copy(jpeg, "/Users/kdintwe/Documents/Classes/Geog_299B/blog_docs/wk8/fireocurrence.jpg")
dev.off()
moran.plot(botfire$Sum_count,nb2listw(botfire.dist.200))
moran.test(botfire$Sum_count,nb2listw(botfire.dist.200, style="W"))
dev.copy(jpeg, "/Users/kdintwe/Documents/Classes/Geog_299B/blog_docs/wk8/moran.jpg")
dev.off()
###################################################

No comments:
Post a Comment